If you're a trader, you've likely heard of Fibonacci. But what exactly is Fibonacci, and how can it help you achieve trading success? In this article, we'll explore the power of Fibonacci retracements, extensions, and time, and how you can use them to gain an edge in the markets.
But what is Fibonacci?
Fibonacci is a sequence of numbers that has been studied and applied in various fields, including mathematics, science, and finance. The sequence is derived by adding the two previous numbers in the sequence to generate the next number, starting with 0 and 1. The sequence continues infinitely, and the numbers in the sequence have a unique mathematical relationship with one another, which has been found to occur naturally in various phenomena.

What are Fibonacci Retracements?
Fibonacci retracements are a popular technical analysis tool used by traders to identify potential levels of support and resistance. These levels are derived from the Fibonacci sequence, which is a mathematical sequence of numbers in which each number is the sum of the two preceding numbers (e.g., 0, 1, 1, 2, 3, 5, 8, 13, 21, 34, etc.).
Fibonacci retracement levels are drawn by connecting a high point to a low point on a price chart, and then dividing the vertical distance by the key Fibonacci ratios of 23.6%, 38.2%, 50%, 61.8%, 78.6%, 88.6% and 100%. These levels can then be used to identify potential support or resistance areas where price may reverse or continue its trend.
How do Fibonacci retracements work?
Fibonacci retracements work by identifying key levels of support and resistance based on the Fibonacci sequence. These levels can act as potential turning points for price, which can be used to enter or exit trades.
For example, if a trader sees that price is approaching a key Fibonacci retracement level, they may look for additional signals or indicators to confirm a potential reversal or continuation of the trend. Alternatively, if price breaks through a Fibonacci retracement level, it may signal a shift in the overall trend direction.
Examples of Fibonacci retracement levels
Let's take a look at an example of how Fibonacci retracements can be used to identify potential support and resistance levels:

In this example, we have a price chart of the EUR/USD currency pair. We can see that price has been in a downtrend, but has recently started to move higher. We can draw Fibonacci retracement levels by connecting the low and high points of the trend, and then dividing the distance by the Fibonacci ratios of 23.6%, 38.2%, 50%, and 61.8%.
We can see that price has recently retraced to the 61.8% Fibonacci retracement level, which has acted as support.
Is Fibonacci retracement a good strategy?
Fibonacci retracement can be a useful tool for identifying potential support and resistance levels in the markets. However, it's important to use Fibonacci retracements in conjunction with other technical analysis tools to confirm potential trades.
Fibonacci retracements should not be relied upon as the sole basis for making trading decisions. Instead, they should be used in conjunction with other indicators or signals to confirm potential trades.
How accurate are Fibonacci retracements?
The accuracy of Fibonacci retracements will vary depending on the market and the specific price chart being analysed. While Fibonacci retracements can be a useful tool for identifying potential levels of support and resistance, they should not be relied upon as the sole basis for making trading decisions.
It's important to use Fibonacci retracements in conjunction with other technical analysis tools, as well as sound risk management principles, to increase the likelihood of success in trading.

What is the strongest Fibonacci retracement?
There is no single "strongest" Fibonacci retracement level. The significance of each retracement level will depend on the specific market and price chart being analyzed. Traders should look for confluence between Fibonacci retracement levels and other indicators or signals to identify the strongest potential support or resistance areas.
How to Use Fibonacci Retracements in Your Trading
Fibonacci retracements can be used as a standalone trading strategy or in combination with other technical analysis tools. Here are a few things to keep in mind when using Fibonacci retracements in your trading:
Look for confluence: When using Fibonacci retracements, it's important to look for confluence with other indicators or signals to confirm potential trades. For example, you may look for a Fibonacci retracement level that coincides with a key moving average or trendline.
Use sound risk management principles: As with any trading strategy, it's important to use sound risk management principles when using Fibonacci retracements. This may include setting stop-loss orders, limiting position sizes, and using proper position sizing.
Be patient: Trading can be a waiting game, and it's important to be patient when waiting for potential trades to develop. Don't rush into trades based solely on a Fibonacci retracement level; wait for additional confirmation before entering a trade.
What is the strongest Fibonacci retracement?
There is no single "strongest" Fibonacci retracement level. The significance of each retracement level will depend on the specific market and price chart being analysed. For example crypto often reacts well to the golden ratio (61.8%) and the 78.6% level. Forex and stocks have a higher hit rate with the 50% retracement. Traders should look for confluence between Fibonacci retracement levels and other indicators or signals to identify the strongest potential support or resistance areas.
Combining Fibonacci with Other Technical Analysis Tools
Fibonacci retracements can be a powerful tool when used in combination with other forms of technical analysis. By looking for confluence between multiple forms of technical analysis, you can increase the likelihood of making profitable trades.
For example, a trader may use Fibonacci retracements in combination with the following forms of technical analysis:
Examples of using Fibonacci retracements in confluence with other forms of technical analysis
Let's take a look at an example of how Fibonacci retracements can be used in confluence with other forms of technical analysis:
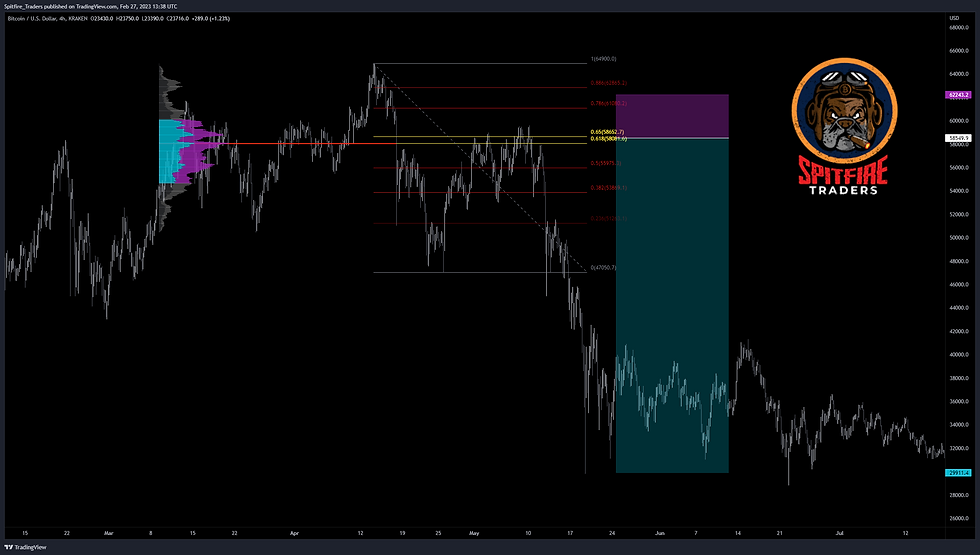
In this example, we have a price chart of the BTC/USD cryptocurrency pair. We can see that price has been in a downtrend, but has recently started to move higher. We can draw Fibonacci retracement levels by connecting the high and low points of the trend, and then dividing the distance by the Fibonacci ratios of 23.6%, 38.2%, 50%, and 61.8%.
From this we can see that the golden pocket (61.8% ratio) lines up with the volume point of control so we can look for a potential trade from this level.
Fibonacci Extensions and Time
In addition to retracements, Fibonacci can also be used to identify potential levels of support and resistance through extensions and time zones.
Definition and explanation of Fibonacci extensions
Fibonacci extensions are a tool used by traders to identify potential levels of support or resistance beyond the current trend. These levels are drawn by connecting a high point to a low point on a price chart, and then extending the distance beyond the current trend.
The key Fibonacci extension levels are 0%, 61.8%, 100%, 161.8%, and 261.8%. These levels can be used to identify potential areas of price extension, which can be used to enter or exit trades.

How to use Fibonacci extensions in your trading
Fibonacci extensions can be used in a similar way to Fibonacci retracements, by identifying potential levels of support or resistance beyond the current trend. Traders can use these levels in combination with other indicators or signals to confirm potential trades.
For example, if a trader sees that price is approaching a key Fibonacci extension level, they may look for to take profits or look to confirm a potential reversal of the trend. Alternatively, if price breaks through a Fibonacci extension level, it may signal a continuation of trend direction.
Definition and explanation of Fibonacci time zones
Fibonacci time zones are a tool rarely used by traders however, they are extremely powerful once you understand how to use them. These time zones are derived from the Fibonacci sequence, and are based on the number of bars or candles on a price chart.
The key Fibonacci time zones are 1, 1.618, 2.618, 4.236, and 6.854. These time zones can be used to identify potential reversal or continuation points based on the number of bars or candles that have passed since the start of a trend.
How to use Fibonacci time zones in your trading
Fibonacci time zones can be used in a similar way to Fibonacci retracements and extensions, by identifying potential reversal or continuation points based on time. Traders can use these time zones in combination with other indicators or signals to confirm potential trades.
For example, if a trader sees that price has been in an uptrend for a certain number of bars or candles, they may look for a potential reversal at a key Fibonacci time zone. Alternatively, if price breaks through a Fibonacci time zone, it may signal a continuation of the trend.
Do Professionals Use Fibonacci?
Yes, professionals use Fibonacci in their trading strategies. While there is no guarantee of success in trading, using Fibonacci in conjunction with other technical analysis tools can help give traders an edge in the markets. I personally use Fibonacci every day I consider it to be one of the most powerful tools in my kit.
Professional traders may use Fibonacci retracements, extensions, and time zones in combination with other indicators or signals to identify potential trades. They may also use Fibonacci as part of a larger trading plan, which may include sound risk management principles and proper position sizing.

Conclusion
Fibonacci retracements, extensions, and time zones can be powerful tools for identifying potential levels of support and resistance in the markets. By using Fibonacci in conjunction with other technical analysis tools, traders can gain an edge in the markets and increase the likelihood of making profitable trades.
Remember to use Fibonacci as part of a larger trading plan, which may include sound risk management principles and proper position sizing. Don't rely solely on Fibonacci to make trading decisions; instead, look for confluence between multiple indicators or signals to confirm potential trades.
Unleash the power of Fibonacci in your trading, and take your trading to the next level, join our technical analysis course and learn from the professionals. PS. Check out of public YouTube for weekly analysis and trading tips.


